Geoelectrical investigations were carried out to determine the aquifer potentials and protective capacity of Kingsley Ozumba Mbadiwe University Ideato and environs, Imo State, Southeastern Nigeria. A total of twenty-five (25) Vertical Electrical Sounding survey was conducted using the Schlumberger array to evaluate the characteristics of the aquifers in the studied locations. Geoelectric sections derived from the modeling of the sounding data reveal 7 to 9 subsurface layers and characterized by four main sounding curve types-KH-type, HA-type, HK-type and KA-type. The study area is underlain by alternating layers of shale, sand/sandstone and clay. The aquifer is delineated within the sand/sandstone Formation. The aquifer resistivity ranges from 390 to 450000 Ωm, while the aquifer thickness and depth range from 4.7 to 168.6m and 6.5 to 109m respectively. The Dar Zarrouk parameters of longitudinal conductance ranges from 0.000227 to 0.12134 mhos, whereas the transverse resistance ranges from 1833 to 54223904Ωm2. The transmissivity in the study area has its highest value of 684.57 m2/day at Amaikpa Ogboko and its lowest value of 19.08m2/day at Ogume. Overall, the transmissivity of the study area indicates a relatively high to moderate ability of the aquifer to transmit water, with an exception of Ogume. Furthermore, the aquifer potentials of the study area were shown to differ with aquifer size, structure and characteristics and are influenced by the underlying geology generally. The study area has an overall poor aquifer protective capacity. This suggests that the aquifer is very susceptible to surface contaminants and the groundwater is at risk of pollution. Proper environmental and waste monitoring management is therefore strongly suggested in the study area to protect the groundwater resources.
| Published in | American Journal of Physics and Applications (Volume 13, Issue 4) |
| DOI | 10.11648/j.ajpa.20251304.13 |
| Page(s) | 91-106 |
| Creative Commons |
This is an Open Access article, distributed under the terms of the Creative Commons Attribution 4.0 International License (http://creativecommons.org/licenses/by/4.0/), which permits unrestricted use, distribution and reproduction in any medium or format, provided the original work is properly cited. |
| Copyright |
Copyright © The Author(s), 2025. Published by Science Publishing Group |
Groundwater, Aquifer, Protective Capacity, Pollution, VES
Longitudinal Conductance (mhos) | Protective Capacity Rating |
|---|---|
˃ 10 | Excellent |
5-10 | Very Good |
0.7-4.9 | Good |
0.2-0.69 | Moderate |
0.1-0.19 | Weak |
< 0.1 | Poor |
VESNO | Location | Longitude E (Degree) | Latitude N (Degree) | Elevation (m) | Curve Type | Number of Layers |
|---|---|---|---|---|---|---|
1 | Senate Building KOMU | 7.08228 | 5.82721 | 164 | KH | 8 |
2 | Faculty of Science KOMU | 7.08100 | 5.82862 | 159 | HKA | 9 |
3 | Library KOMU | 7.08295 | 5.82812 | 164 | KH | 7 |
4 | Female Hotel KOMU | 7.08585 | 5.83052 | 183 | HA | 8 |
5 | Students Center KOMU | 7.08660 | 5.82927 | 187 | HA | 8 |
6 | Back of Senate Building | 7.08083 | 5.82563 | 162 | K | 8 |
7 | University Backgate (Amaikpa Ogboko) | 7.08517 | 5.74070 | 173 | KA | 8 |
8 | Health Center Ogboko | 7.08677 | 5.82162 | 175 | KH | 9 |
9 | Beside Stadium KOMU | 7.09363 | 5.82359 | 151 | HA | 8 |
10 | G.S. Building KOMU | 7.08628 | 5.82772 | 186 | KH | 7 |
11 | Love Garden | 7.08186 | 5.82905 | 164 | HK | 8 |
12 | JUPEB Center KOMU | 7.08033 | 5.82962 | 163 | KH | 7 |
13 | Medical Center KOMU | 7.08334 | 5.82608 | 167 | KH | 8 |
14 | Benahillz Hotel Ogboko | 7.08852 | 5.82615 | 195 | HA | 7 |
15 | Umuduruanyanwu Obiohia | 7.07695 | 5.83897 | 135 | K | 7 |
16 | Rochas Foundation College Ogboko | 7.08290 | 5.82771 | 193 | KHA | 8 |
17 | Ikpanta Urualla | 7.08425 | 5.84915 | 198 | A | 8 |
18 | Ogume | 7.06822 | 5.80798 | 188 | HK | 8 |
19 | Umuokwaraonure Ogboko | 7.08700 | 5.81593 | 179 | KH | 8 |
20 | Ukabi Ogboko | 7.09363 | 5.82359 | 193 | K | 8 |
21 | Staff Quarters 1 KOMU | 7.07723 | 5.84117 | 152 | HA | 8 |
22 | Staff Quarters 2 KOMU | 7.07859 | 5.84012 | 157 | HK | 8 |
23 | 5 Star Hotel Ogboko | 7.07850 | 5.83525 | 165 | HA | 7 |
24 | Behind JUPEB KOMU | 7.07902 | 5.83048 | 160 | A | 8 |
25 | Umuokwaraocha Umuchima | 7.07307 | 5.82892 | 126 | HA | 8 |
Location | Aquifer Resistivity (Ωm) | Depth to Aquifer Table (m) | Aquifer Thickness (m) | Aquifer Conductivity (Ωm)-1 | Aquifer TransverseResistance (Ωm2) | Aquifer Longitudinal Conductance (mhos) | Estimated Hydraulic Conductivity (m/day) | Estimated Transmissivity (m2/day) |
|---|---|---|---|---|---|---|---|---|
Senate Building KOMU | 211460 | 94.5 | 115.5 | 4.72903E-06 | 24423630 | 0.000546 | 4.060032 | 468.93 |
Faculty of Science KOMU | 11740 | 82.7 | 127.3 | 8.51789E-05 | 1494502 | 0.010843 | 4.059692 | 516.80 |
Library KOMU | 6235 | 102 | 108 | 1.60385E-04 | 673380 | 0.017322 | 4.060232 | 438.50 |
Female Hotel KOMU | 1148 | 70.7 | 139.3 | 8.71080E-04 | 1599160 | 0.121341 | 4.060017 | 565.56 |
Students Center KOMU | 130186 | 65.9 | 144.1 | 7.68132E-06 | 18759803 | 0.001107 | 4.061803 | 585.31 |
Back of Senate Building | 273502 | 54.6 | 155.4 | 3.65628E-06 | 42502211 | 0.000568 | 4.047830 | 629.03 |
University Backgate (Amaikpa Ogboko) | 15456 | 41.4 | 168.6 | 6.46998E-05 | 2605882 | 0.010908 | 4.060291 | 684.57 |
Health Center Ogboko | 98012 | 94 | 116 | 1.02028E-05 | 11369392 | 0.001184 | 4.057697 | 470.69 |
Beside Stadium KOMU | 77843 | 87 | 123 | 1.28464E-05 | 9576689 | 0.001580 | 4.063404 | 499.80 |
G.S. Building KOMU | 191647 | 89.4 | 120.6 | 5.21793E-06 | 23112628 | 0.000629 | 4.062916 | 489.99 |
Love Garden | 145000 | 63 | 147 | 6.89655E-06 | 21315000 | 0.001014 | 4.060000 | 596.82 |
JUPEB Center KOMU | 91912 | 109 | 101 | 1.08800E-05 | 9283112 | 0.001099 | 4.062510 | 410.31 |
Medical Center KOMU | 450000 | 108 | 102 | 2.22222E-06 | 45900000 | 0.000227 | 4.050000 | 413.10 |
Benahillz Hotel Ogboko | 2109 | 87 | 123 | 4.74158E-04 | 259407 | 0.058321 | 4.060036 | 499.38 |
Obiohia | 15764 | 81.6 | 128.4 | 6.34357E-05 | 2024098 | 0.008145 | 4.059230 | 521.21 |
Rochas Foundation College Ogboko | 389540 | 99.7 | 110.3 | 2.56713E-06 | 42966262 | 0.000283 | 4.051216 | 446.85 |
Ikpanta Urualla | 9954 | 91 | 119 | 1.00462E-04 | 1184526 | 0.011955 | 4.060237 | 483.17 |
Ogume | 390 | 6.5 | 4.7 | 2.56410E-03 | 1833 | 0.012051 | 4.059978 | 19.08 |
Umuokwaraonure Ogboko | 2370 | 21.5 | 49.6 | 4.21585E-04 | 117651 | 0.020928 | 4.056492 | 201.20 |
Ukabi Ogboko | 1674 | 76.6 | 133.4 | 5.97372E-04 | 223312 | 0.079689 | 4.059952 | 541.60 |
Staff Quarters 1 KOMU | 222701 | 91 | 119 | 4.49033E-06 | 26501419 | 0.000534 | 4.053158 | 482.33 |
Staff Quarters 2 KOMU | 36446 | 91 | 119 | 2.74379E-05 | 4337074 | 0.003265 | 4.060084 | 483.15 |
5 Star Hotel Ogboko | 404656 | 76 | 134 | 2.47123E-06 | 54223904 | 0.000331 | 4.046560 | 542.24 |
Behind JUPEB KOMU | 44747 | 86.1 | 88.9 | 2.23479E-05 | 3978008 | 0.001987 | 4.058553 | 360.81 |
Umuokwaraocha Umuchima | 14750 | 41.9 | 83 | 6.77966E-05 | 122425 | 0.005627 | 4.060675 | 337.04 |
Location | Aquifer Protective Capacity (mhos) | Rating |
|---|---|---|
Senate Building KOMU | 0.027149 | Poor |
Faculty of Science KOMU | 0.052318 | Poor |
Library KOMU | 0.101279 | Weak |
Female Hotel KOMU | 0.015501 | Poor |
Students Center KOMU | 0.046855 | Poor |
Back of Senate Building | 0.008424 | Poor |
University Backgate (Amaikpa Ogboko) | 0.022708 | Poor |
Health Center Ogboko | 0.038284 | Poor |
Beside Stadium KOMU | 0.036409 | Poor |
G.S. Building KOMU | 0.024992 | Poor |
Love Garden | 0.074661 | Poor |
JUPEB Center KOMU | 0.021957 | Poor |
Medical Center KOMU | 0.019224 | Poor |
Benahillz Hotel Ogboko | 0.022350 | Poor |
Umuduruanyanwu Obiohia | 1.459034 | Good |
Rochas Foundation College Ogboko | 0.017427 | Poor |
Ikpanta Urualla | 0.029723 | Poor |
Ogume | 0.056567 | Poor |
Umuokwaraonure Ogboko | 0.030222 | Poor |
Ukabi Ogboko | 0.129084 | Weak |
Staff Quarters 1 KOMU | 0.095207 | Poor |
Staff Quarters 2 KOMU | 0.091130 | Poor |
5 Star Hotel Ogboko | 0.043584 | Poor |
Behind JUPEB KOMU | 0.002298 | Poor |
Umuokwaraocha Umuchima | 0.037803 | Poor |
VES | Vertical Electrical Sounding |
GPS | Global Positioning System |
KOMU | Kingsley Ozumba Mbadiwe University |
JUPEB | Joint Universities Preliminary Examinations Board |
GS | General Studies |
| [1] | Nwaemene, I. M., Agbodike, I. I. C. Assessment of groundwater vulnerability to pollution in Kingsley Ozumba Mbadiwe University Ideato and environs Using drastic method. International Journal of Research in Engineering and Science. 2024b, 12(8), 115-123. |
| [2] | Singh, P. Engineering and general geology for B. E. (Civil Mining, Metallurgy Engineering), B. Sc., and A. M. I. E courses. S. K. Katara and Sons, Delhi; 2007. |
| [3] | McDonald, A. M., Davies, J., Dochartagh, B. E. O. Simple methods for assessing groundwater resources in low permeability areas of Africa. In: British geological survey commissioned report; 2002, CR/01/168N. |
| [4] | Ibuot, J. C., Obiora, D. N., Ekpa, M. M. M., Okoroh, D. O. Geoelectrohydraulic investigation of the surficial aquifer unit sand corrosivity in parts of Uyo L. G. A., Akwa Ibom State, southern Nigeria. Appl Water Sci. 2017b, 7, 4705-4713. |
| [5] | Obiora, D. N., Ajala, A. E., Ibuot, J. C. Evaluation of aquifer protective capacity of overburden unit and soil corrosivity in Makurdi, Benue state, Nigeria, using electrical resistivity method. J Earth Syst Sci. 2015, 124(1), 125-135. |
| [6] | Alhassan, D. U., Obiora, D. N., Okeke, F. N. The assessment of aquifer potentials and aquifer vulnerability of southern Paiko, northcentral Nigeria, using geoelectric method. Global J Pure Appl Sci. 2015, 21, 51-70. |
| [7] | Ojo, E. O., Adelowo, A., Abdulkarim, H. M., Dauda, A. K. A probe into the corrosivity of the main campus of the University of Abuja, Nigeria; using resistivity method. Physical journal. 2015, 1(2), 172. |
| [8] | Sahu. P. C., Sahoo, H. Targetting groundwater in tribal terminated Bonai Area of drought-prone sundargarh District, Orissa, India. J. Hum. Ecol. 2006, 20, 109. |
| [9] | Agbodike, I. I. C. Evaluation of Aquifer Protective Capacity in parts of Oru LGA Imo State, South-eastern Nigeria Using Resistivity Data. International Journal of Research in Engineering and Science (IJRES). 2023, 11(9), 48-53. |
| [10] | Nwaemene, I. M, Agbodike, I. I. C. Application of water quality index for groundwater quality monitoring and management in Kingsley Ozumba Mbadiwe University Ideato and environs. International Journal of Scientific Engineering and Science. 2024a, 8(8), 39-45. |
| [11] | Uma, K. O (1989). An appraisal of the groundwater resources of the Imo River Basin, Nigeria. Journal of Mining and Geology, 25 (1 & 2), 305-31. |
| [12] | Zohdy, A. A. R, Martin, R. J. A study of sea water intrusion using direct current sounding in the southern part of the Ox ward Plain California; U. S. Geological Survey; 1993. |
| [13] | Niwas, S., Singhal, D. C. Estimation of aquifer transmissivity from Dar-zarrouk parameters in porous media. Journal of Hydrology. 1981, 50, 393-399. |
| [14] | Henriet, J. P. Direct application of Dar Zarrouk parameters in groundwater survey. Geophys. Prospect. 1976, 24, 344-353. |
| [15] | Oladapo, M. I., Mohammed M. Z., Adeoye, O. O., Adesola, O. O. Geoelectric investigation of the Ondo State housing corporation Estate Ijapo Akure southwestern Nigeria. J Min Geol. 2004, 40(1), 41-48. |
APA Style
Monday, N. I., Chukwuemeka, A. I. I., Young, A. C., Okechukwu, A. K., Loveday, O. T. (2025). Hydrogeophysical Assessment and Protective Capacity of Groundwater Resources in Kingsley Ozumba Mbadiwe University Ideato and Environs, Southeastern Nigeria. American Journal of Physics and Applications, 13(4), 91-106. https://doi.org/10.11648/j.ajpa.20251304.13
ACS Style
Monday, N. I.; Chukwuemeka, A. I. I.; Young, A. C.; Okechukwu, A. K.; Loveday, O. T. Hydrogeophysical Assessment and Protective Capacity of Groundwater Resources in Kingsley Ozumba Mbadiwe University Ideato and Environs, Southeastern Nigeria. Am. J. Phys. Appl. 2025, 13(4), 91-106. doi: 10.11648/j.ajpa.20251304.13
AMA Style
Monday NI, Chukwuemeka AII, Young AC, Okechukwu AK, Loveday OT. Hydrogeophysical Assessment and Protective Capacity of Groundwater Resources in Kingsley Ozumba Mbadiwe University Ideato and Environs, Southeastern Nigeria. Am J Phys Appl. 2025;13(4):91-106. doi: 10.11648/j.ajpa.20251304.13
@article{10.11648/j.ajpa.20251304.13,
  author = {Nwaemene Izuchukwu Monday and Agbodike Ifeanyichukwu Ikechukwu Chukwuemeka and Ahamefula Chukwuemeka Young and Achilike Kennedy Okechukwu and Ogbonna Tochukwu Loveday},
  title = {Hydrogeophysical Assessment and Protective Capacity of Groundwater Resources in Kingsley Ozumba Mbadiwe University Ideato and Environs, Southeastern Nigeria
},
  journal = {American Journal of Physics and Applications},
  volume = {13},
  number = {4},
  pages = {91-106},
  doi = {10.11648/j.ajpa.20251304.13},
  url = {https://doi.org/10.11648/j.ajpa.20251304.13},
  eprint = {https://article.sciencepublishinggroup.com/pdf/10.11648.j.ajpa.20251304.13},
  abstract = {Geoelectrical investigations were carried out to determine the aquifer potentials and protective capacity of Kingsley Ozumba Mbadiwe University Ideato and environs, Imo State, Southeastern Nigeria. A total of twenty-five (25) Vertical Electrical Sounding survey was conducted using the Schlumberger array to evaluate the characteristics of the aquifers in the studied locations. Geoelectric sections derived from the modeling of the sounding data reveal 7 to 9 subsurface layers and characterized by four main sounding curve types-KH-type, HA-type, HK-type and KA-type. The study area is underlain by alternating layers of shale, sand/sandstone and clay. The aquifer is delineated within the sand/sandstone Formation. The aquifer resistivity ranges from 390 to 450000 Ωm, while the aquifer thickness and depth range from 4.7 to 168.6m and 6.5 to 109m respectively. The Dar Zarrouk parameters of longitudinal conductance ranges from 0.000227 to 0.12134 mhos, whereas the transverse resistance ranges from 1833 to 54223904Ωm2. The transmissivity in the study area has its highest value of 684.57 m2/day at Amaikpa Ogboko and its lowest value of 19.08m2/day at Ogume. Overall, the transmissivity of the study area indicates a relatively high to moderate ability of the aquifer to transmit water, with an exception of Ogume. Furthermore, the aquifer potentials of the study area were shown to differ with aquifer size, structure and characteristics and are influenced by the underlying geology generally. The study area has an overall poor aquifer protective capacity. This suggests that the aquifer is very susceptible to surface contaminants and the groundwater is at risk of pollution. Proper environmental and waste monitoring management is therefore strongly suggested in the study area to protect the groundwater resources.},
 year = {2025}
}
TY  - JOUR
T1  - Hydrogeophysical Assessment and Protective Capacity of Groundwater Resources in Kingsley Ozumba Mbadiwe University Ideato and Environs, Southeastern Nigeria

AU  - Nwaemene Izuchukwu Monday
AU  - Agbodike Ifeanyichukwu Ikechukwu Chukwuemeka
AU  - Ahamefula Chukwuemeka Young
AU  - Achilike Kennedy Okechukwu
AU  - Ogbonna Tochukwu Loveday
Y1  - 2025/07/30
PY  - 2025
N1  - https://doi.org/10.11648/j.ajpa.20251304.13
DO  - 10.11648/j.ajpa.20251304.13
T2  - American Journal of Physics and Applications
JF  - American Journal of Physics and Applications
JO  - American Journal of Physics and Applications
SP  - 91
EP  - 106
PB  - Science Publishing Group
SN  - 2330-4308
UR  - https://doi.org/10.11648/j.ajpa.20251304.13
AB  - Geoelectrical investigations were carried out to determine the aquifer potentials and protective capacity of Kingsley Ozumba Mbadiwe University Ideato and environs, Imo State, Southeastern Nigeria. A total of twenty-five (25) Vertical Electrical Sounding survey was conducted using the Schlumberger array to evaluate the characteristics of the aquifers in the studied locations. Geoelectric sections derived from the modeling of the sounding data reveal 7 to 9 subsurface layers and characterized by four main sounding curve types-KH-type, HA-type, HK-type and KA-type. The study area is underlain by alternating layers of shale, sand/sandstone and clay. The aquifer is delineated within the sand/sandstone Formation. The aquifer resistivity ranges from 390 to 450000 Ωm, while the aquifer thickness and depth range from 4.7 to 168.6m and 6.5 to 109m respectively. The Dar Zarrouk parameters of longitudinal conductance ranges from 0.000227 to 0.12134 mhos, whereas the transverse resistance ranges from 1833 to 54223904Ωm2. The transmissivity in the study area has its highest value of 684.57 m2/day at Amaikpa Ogboko and its lowest value of 19.08m2/day at Ogume. Overall, the transmissivity of the study area indicates a relatively high to moderate ability of the aquifer to transmit water, with an exception of Ogume. Furthermore, the aquifer potentials of the study area were shown to differ with aquifer size, structure and characteristics and are influenced by the underlying geology generally. The study area has an overall poor aquifer protective capacity. This suggests that the aquifer is very susceptible to surface contaminants and the groundwater is at risk of pollution. Proper environmental and waste monitoring management is therefore strongly suggested in the study area to protect the groundwater resources.
VL  - 13
IS  - 4
ER  -
Department of Physics, Imo State University, Owerri, Nigeria
Department of Physics, Imo State University, Owerri, Nigeria
Department of Physics, Gregory University, Uturu, Nigeria
Department of Physics, Abia State University, Uturu, Nigeria
Department of Physics, Imo State University, Owerri, Nigeria
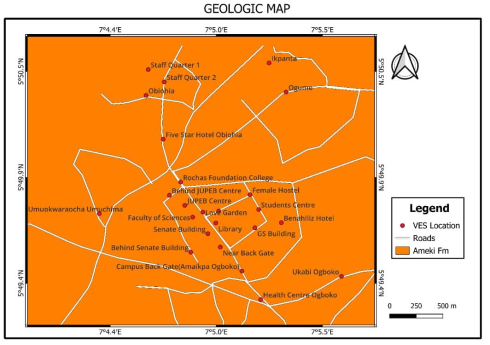
Figure 1. Accessibility map of the study area with VES locations.
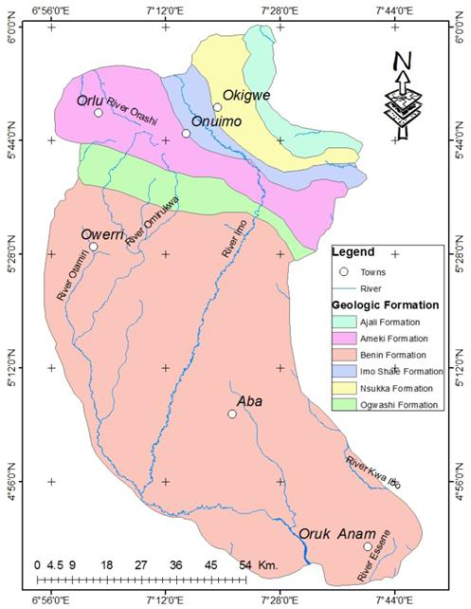
Figure 2. Geological map of Imo River basin [11].
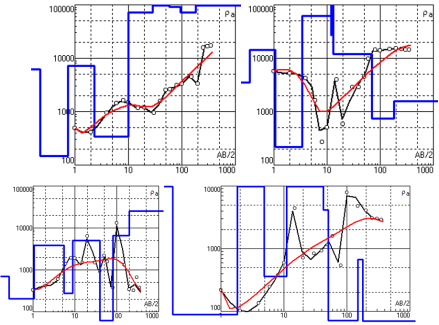
Figure 3. Interpretative curves from some of the VES data.
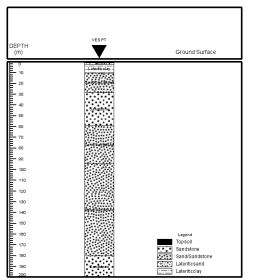
Figure 4. Geoelectric section beneath VES 1 (Senate Building KOMU).
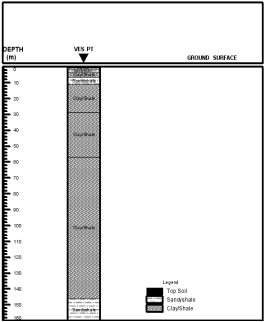
Figure 5. Geoelectric section beneath VES 18 (Ogume).
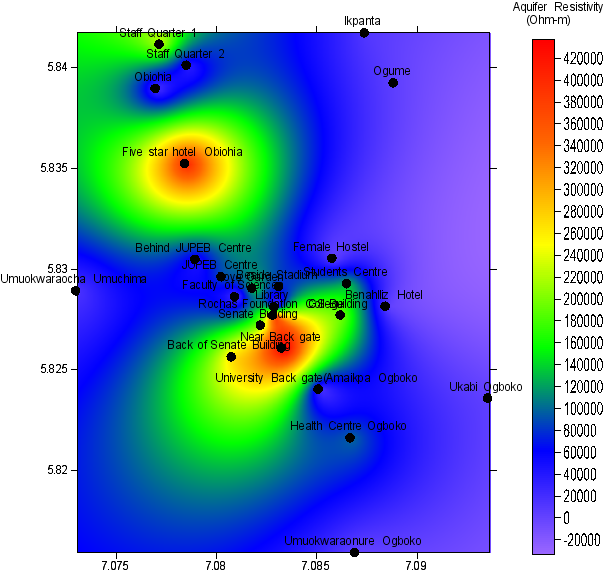
Figure 6. 2D contour map of aquifer resistivity.
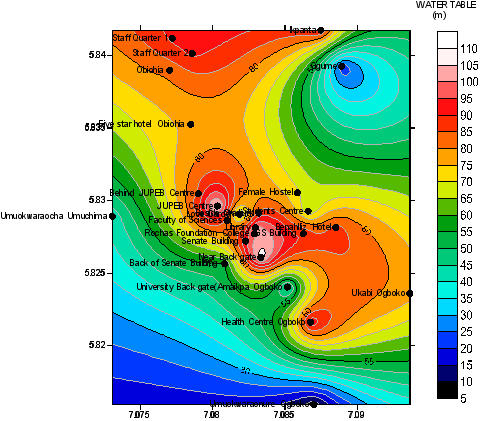
Figure 7. 2D contour map of depth to aquifer table.
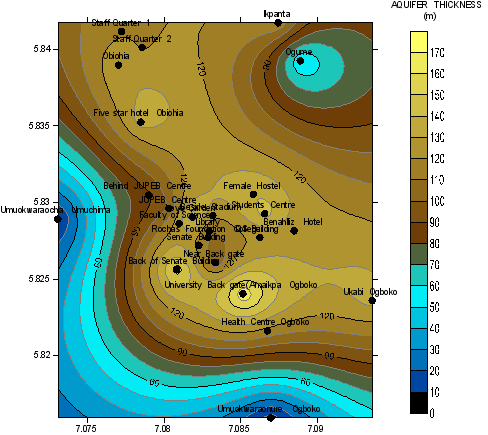
Figure 8. 2D contour map of aquifer thickness.
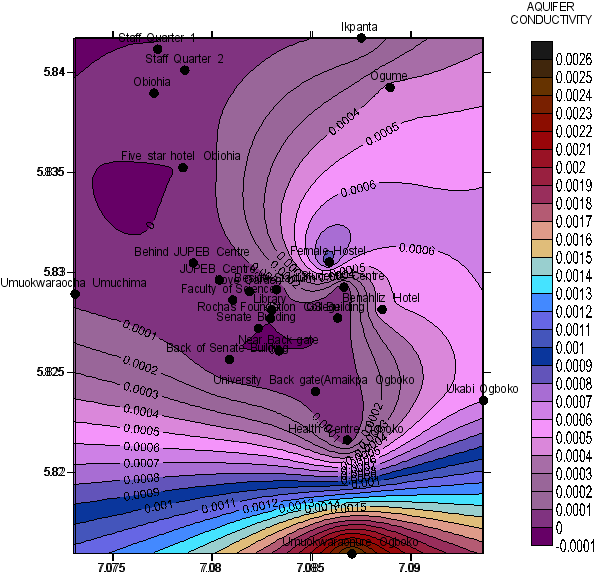
Figure 9. 2D contour map of aquifer conductivity.
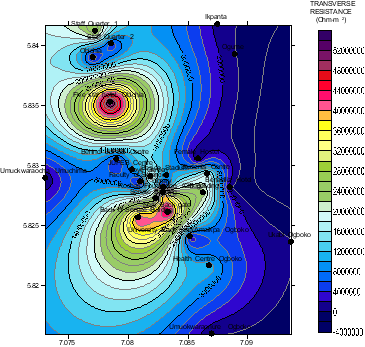
Figure 10. 2D contour map of aquifer transverse resistance.
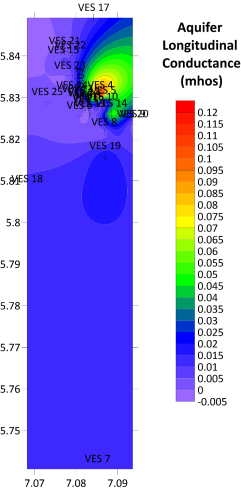
Figure 11. 2D contour map of aquifer longitudinal conductance.
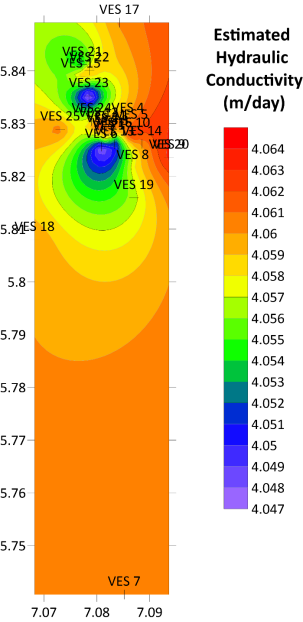
Figure 12. 2D contour map of estimated hydraulic conductivity.
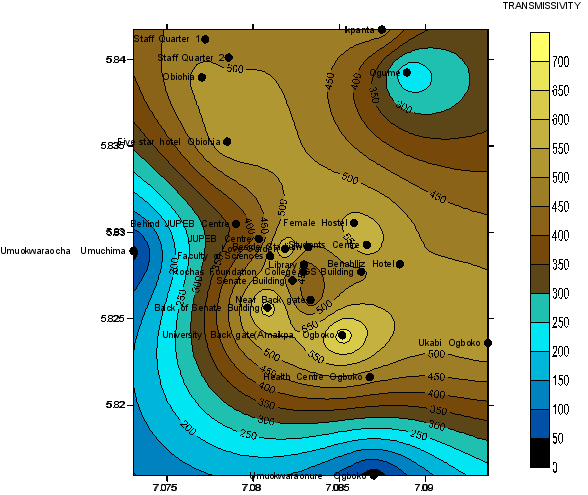
Figure 13. 2D contour map of hydraulic transmissivity.
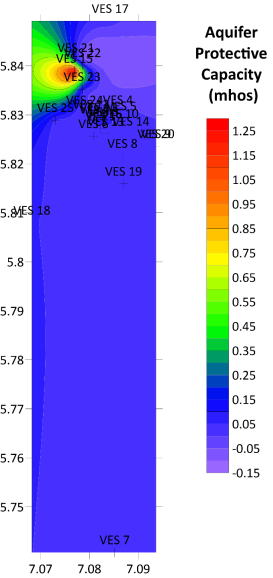
Figure 14. Spatial distribution of aquifer protective capacity in the study area.

